
Operations
Run Mandate day to day.
Where admins live once traffic is flowing: a live dashboard, a queryable audit trail with cryptographic proof, usage figures, and signed delivery into your SIEM.
Your dashboard
See what's happening, at a glance.
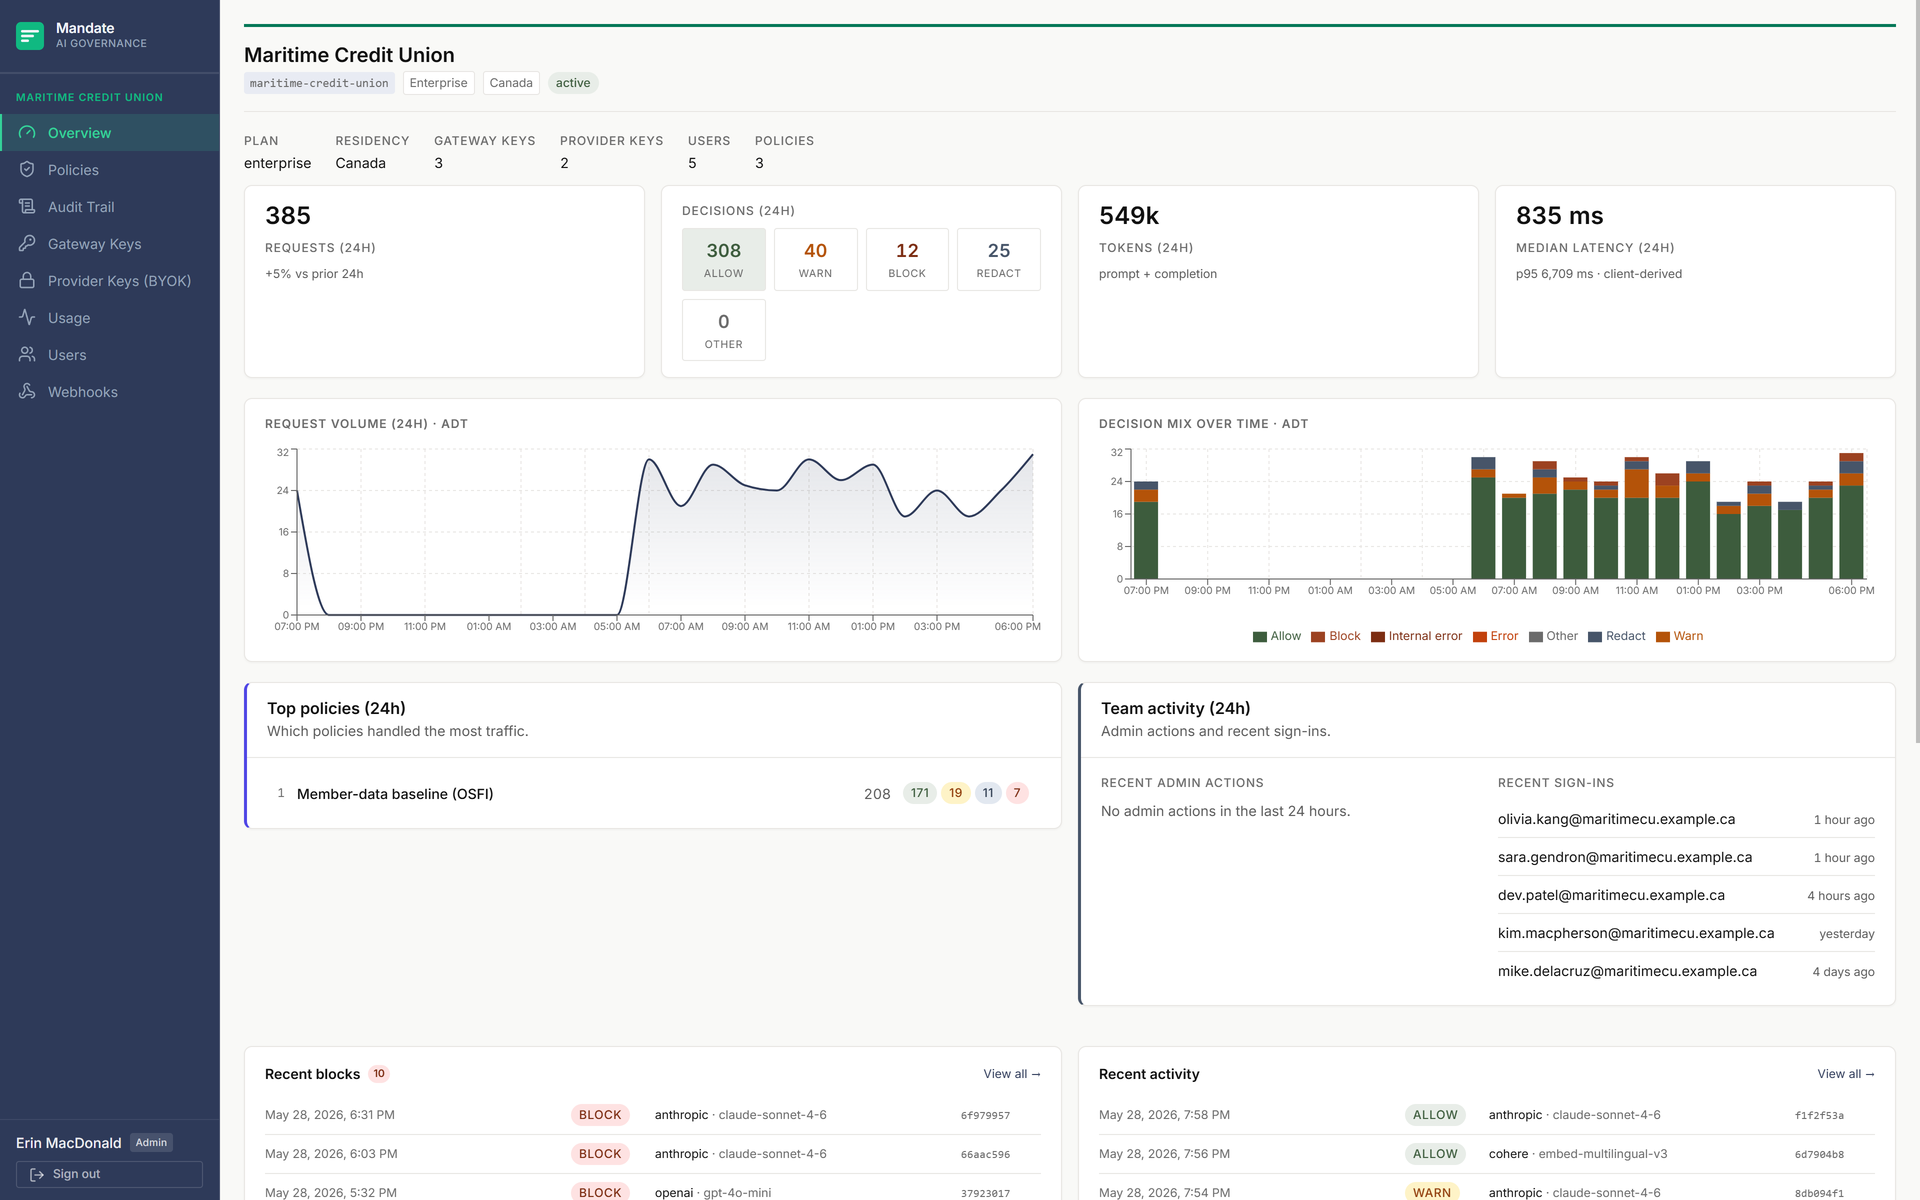
The first screen after sign-in: request volume, decision mix, recent blocks and redactions, team activity. Built for the question “is anything weird going on?”
Audit trail
Every decision, queryable, replayable.
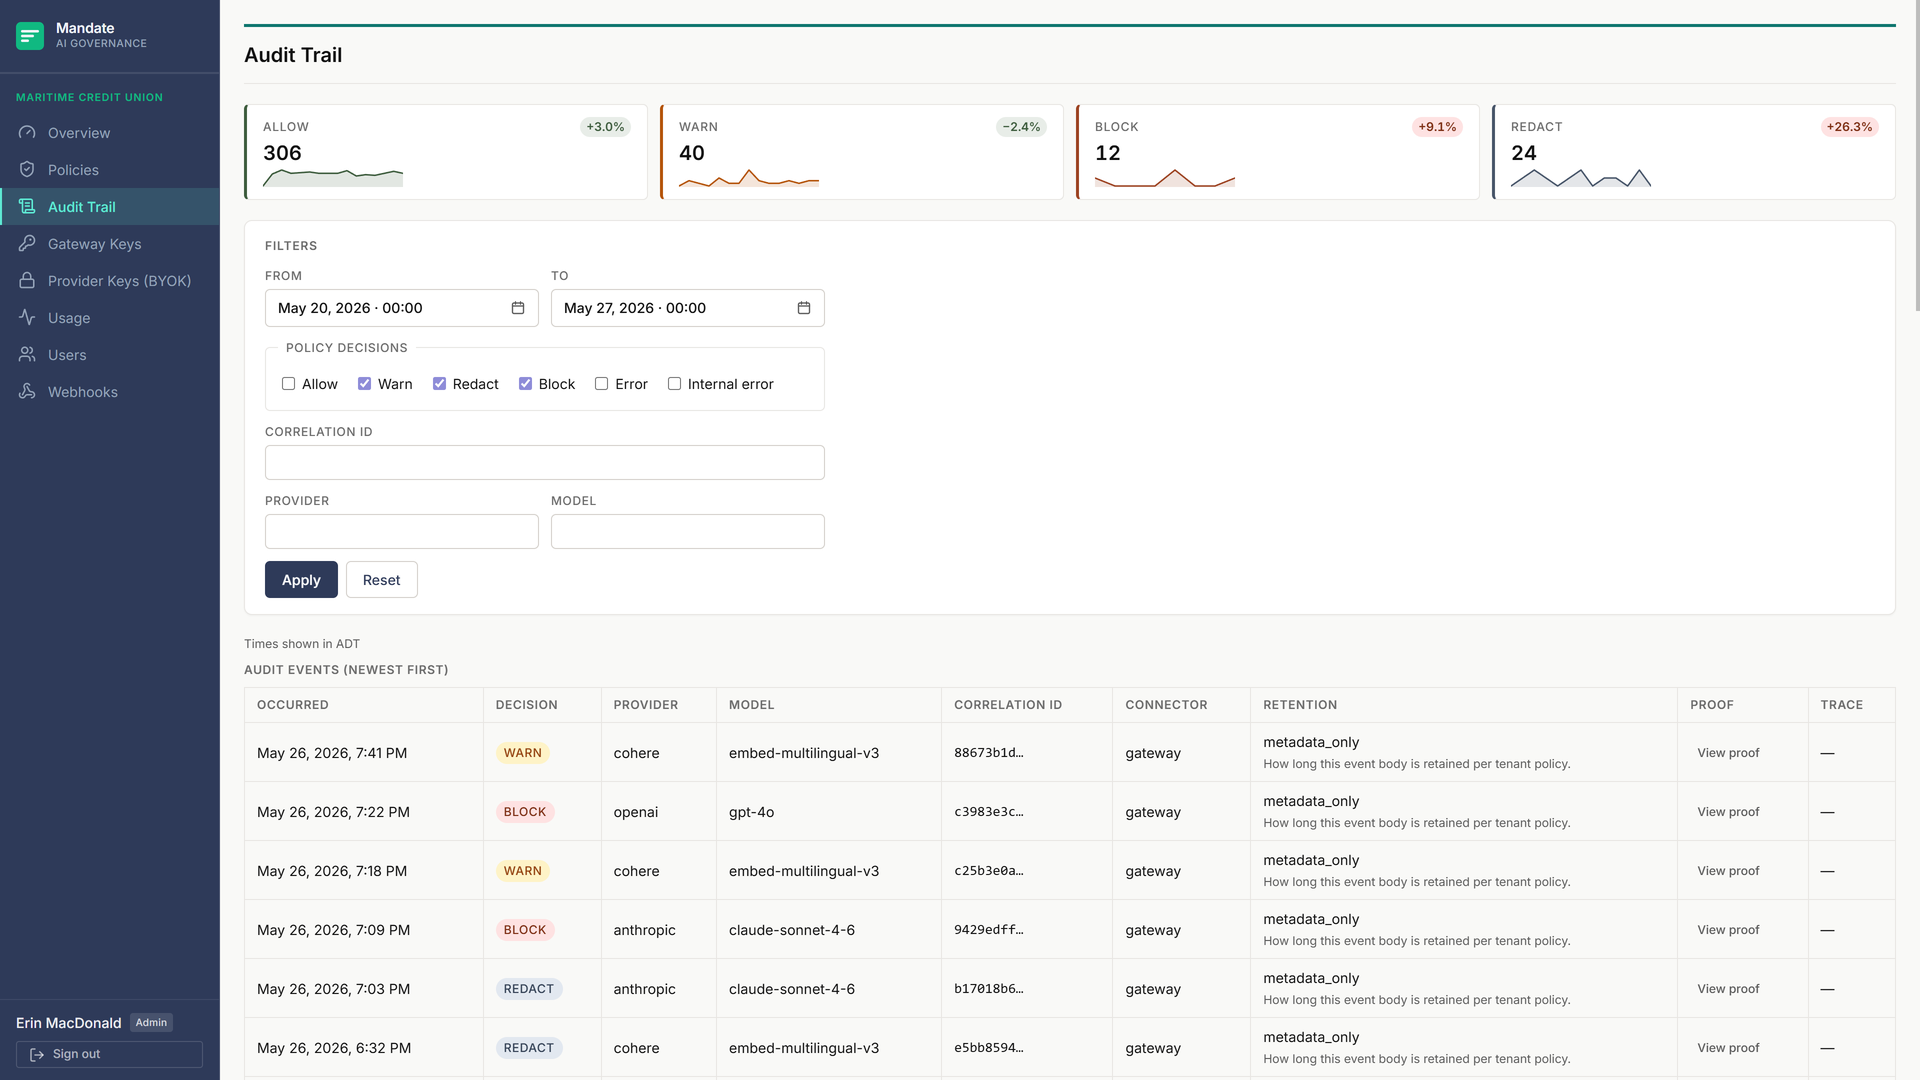
Filter the full log by date, decision, provider, model, or correlation id. Where your tenant retains request bodies, an inspector shows them with secrets masked. Every event opens a proof drawer.
Cryptographic proof
Verify any record in your browser, or offline with no Mandate tooling.
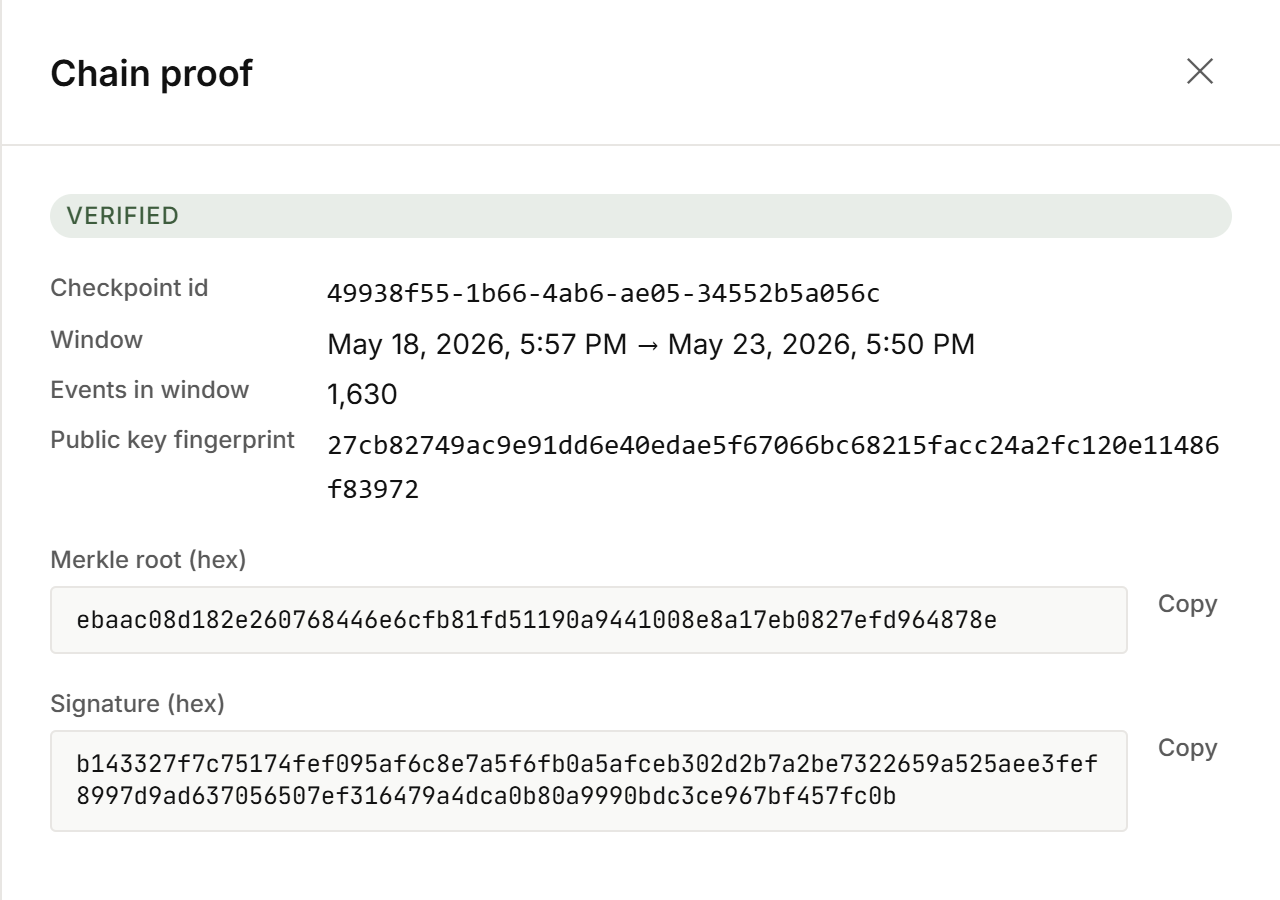
Click “View proof” on any event and the drawer verifies the checkpoint’s Ed25519 signature locally in your browser. A green result means the record matches its checkpoint and the checkpoint matches the pinned signing key, whose fingerprint is shown for your auditor to pin.
-
No round-trip to Mandate to verify
The bundle carries the public key alongside the signature. An auditor can re-run the verification with any Ed25519 library, without us.
-
Tamper-evident by design
Per-row hash chain. Periodic signed checkpoints. Any altered row breaks the chain at that point, and any altered checkpoint fails the signature check. An auditor verifies an export on their own machine; the chain itself is walked against the live records.
-
Pinnable public-key fingerprint
The signing public-key fingerprint is published alongside every proof. Your auditor pins it. If the fingerprint ever changes, your team is the first to know.
Agent activity
Watch your agents the way you watch your people.
Every registered agent has its own page: the tool calls it made, the decision on each, the policy that fired, in the same audit trail as your people. Revoke an agent and its next request is refused.
Governance signals
Signals on the program itself.
Mandate watches its own configuration: policies drifting from catalog defaults, rules falling behind newly added detectors, and traffic concentrating on a single provider or model.
For the auditor
The decision register and the evidence pack.
Two views built for the moment someone asks you to prove what happened.
-
Decision register
Every policy decision and configuration change in one view, each row naming the actor who caused it, admin or agent. No “system” black box. Filter it, or export structured JSON.
-
Evidence pack
A signed bundle for a date range: policy history, decision register, signed checkpoints, and the detector catch-rate attestation. One Ed25519 signature over the manifest; your auditor re-verifies it offline. Try it on a sample pack.
Usage tracking
Usage you can read at a glance.
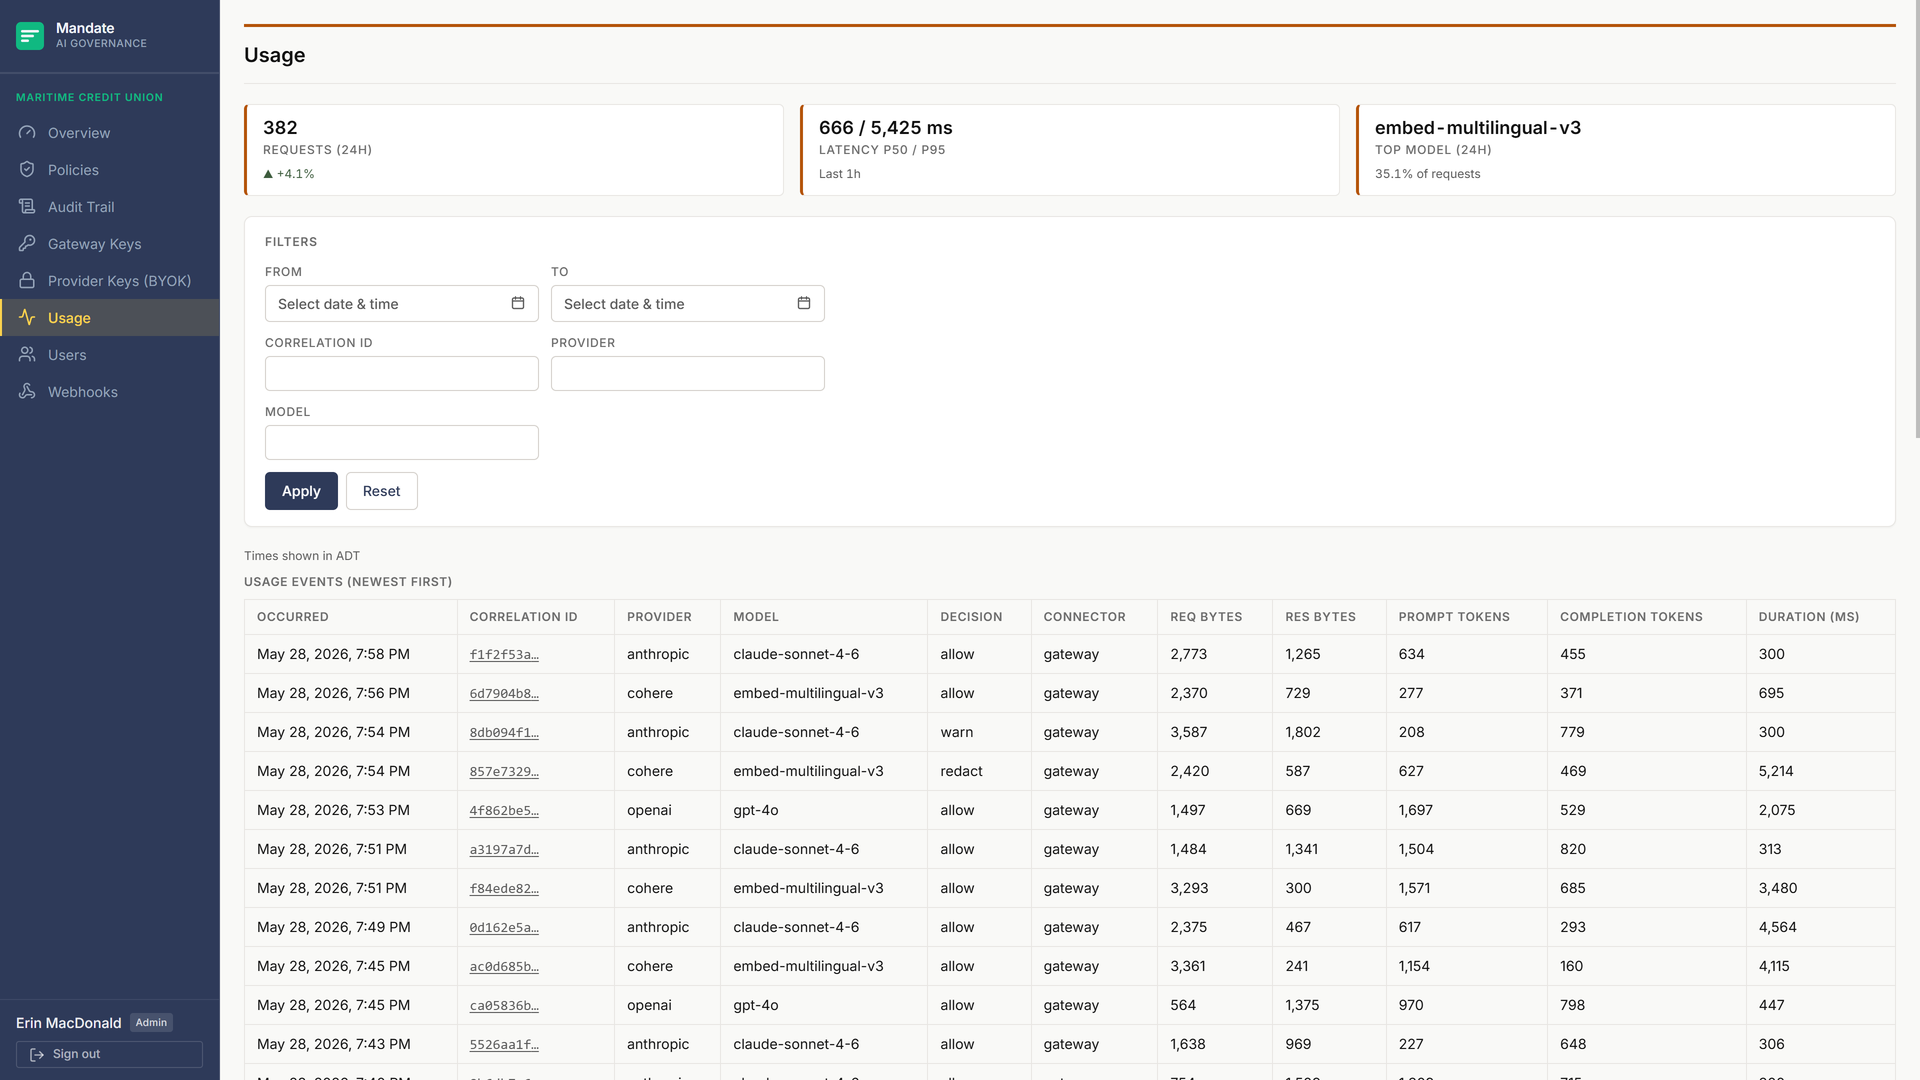
Requests, tokens, and p50 / p95 / p99 latency over a window you pick, with a filterable table beneath. No dollar amounts: provider costs stay on your provider’s bill.
SIEM integration
Push every event to your SIEM.
Signed JSON webhooks to Microsoft Sentinel, Splunk, or any endpoint that accepts one. You set the endpoint, key identifier, retries, and timeout; a Test button proves the integration before traffic flows.